your first visualizer...
at least... I presume that’s what you’re here for
(this tutorial will take about 1-2 hours. it's recommended that you set up hackatime before you begin.)
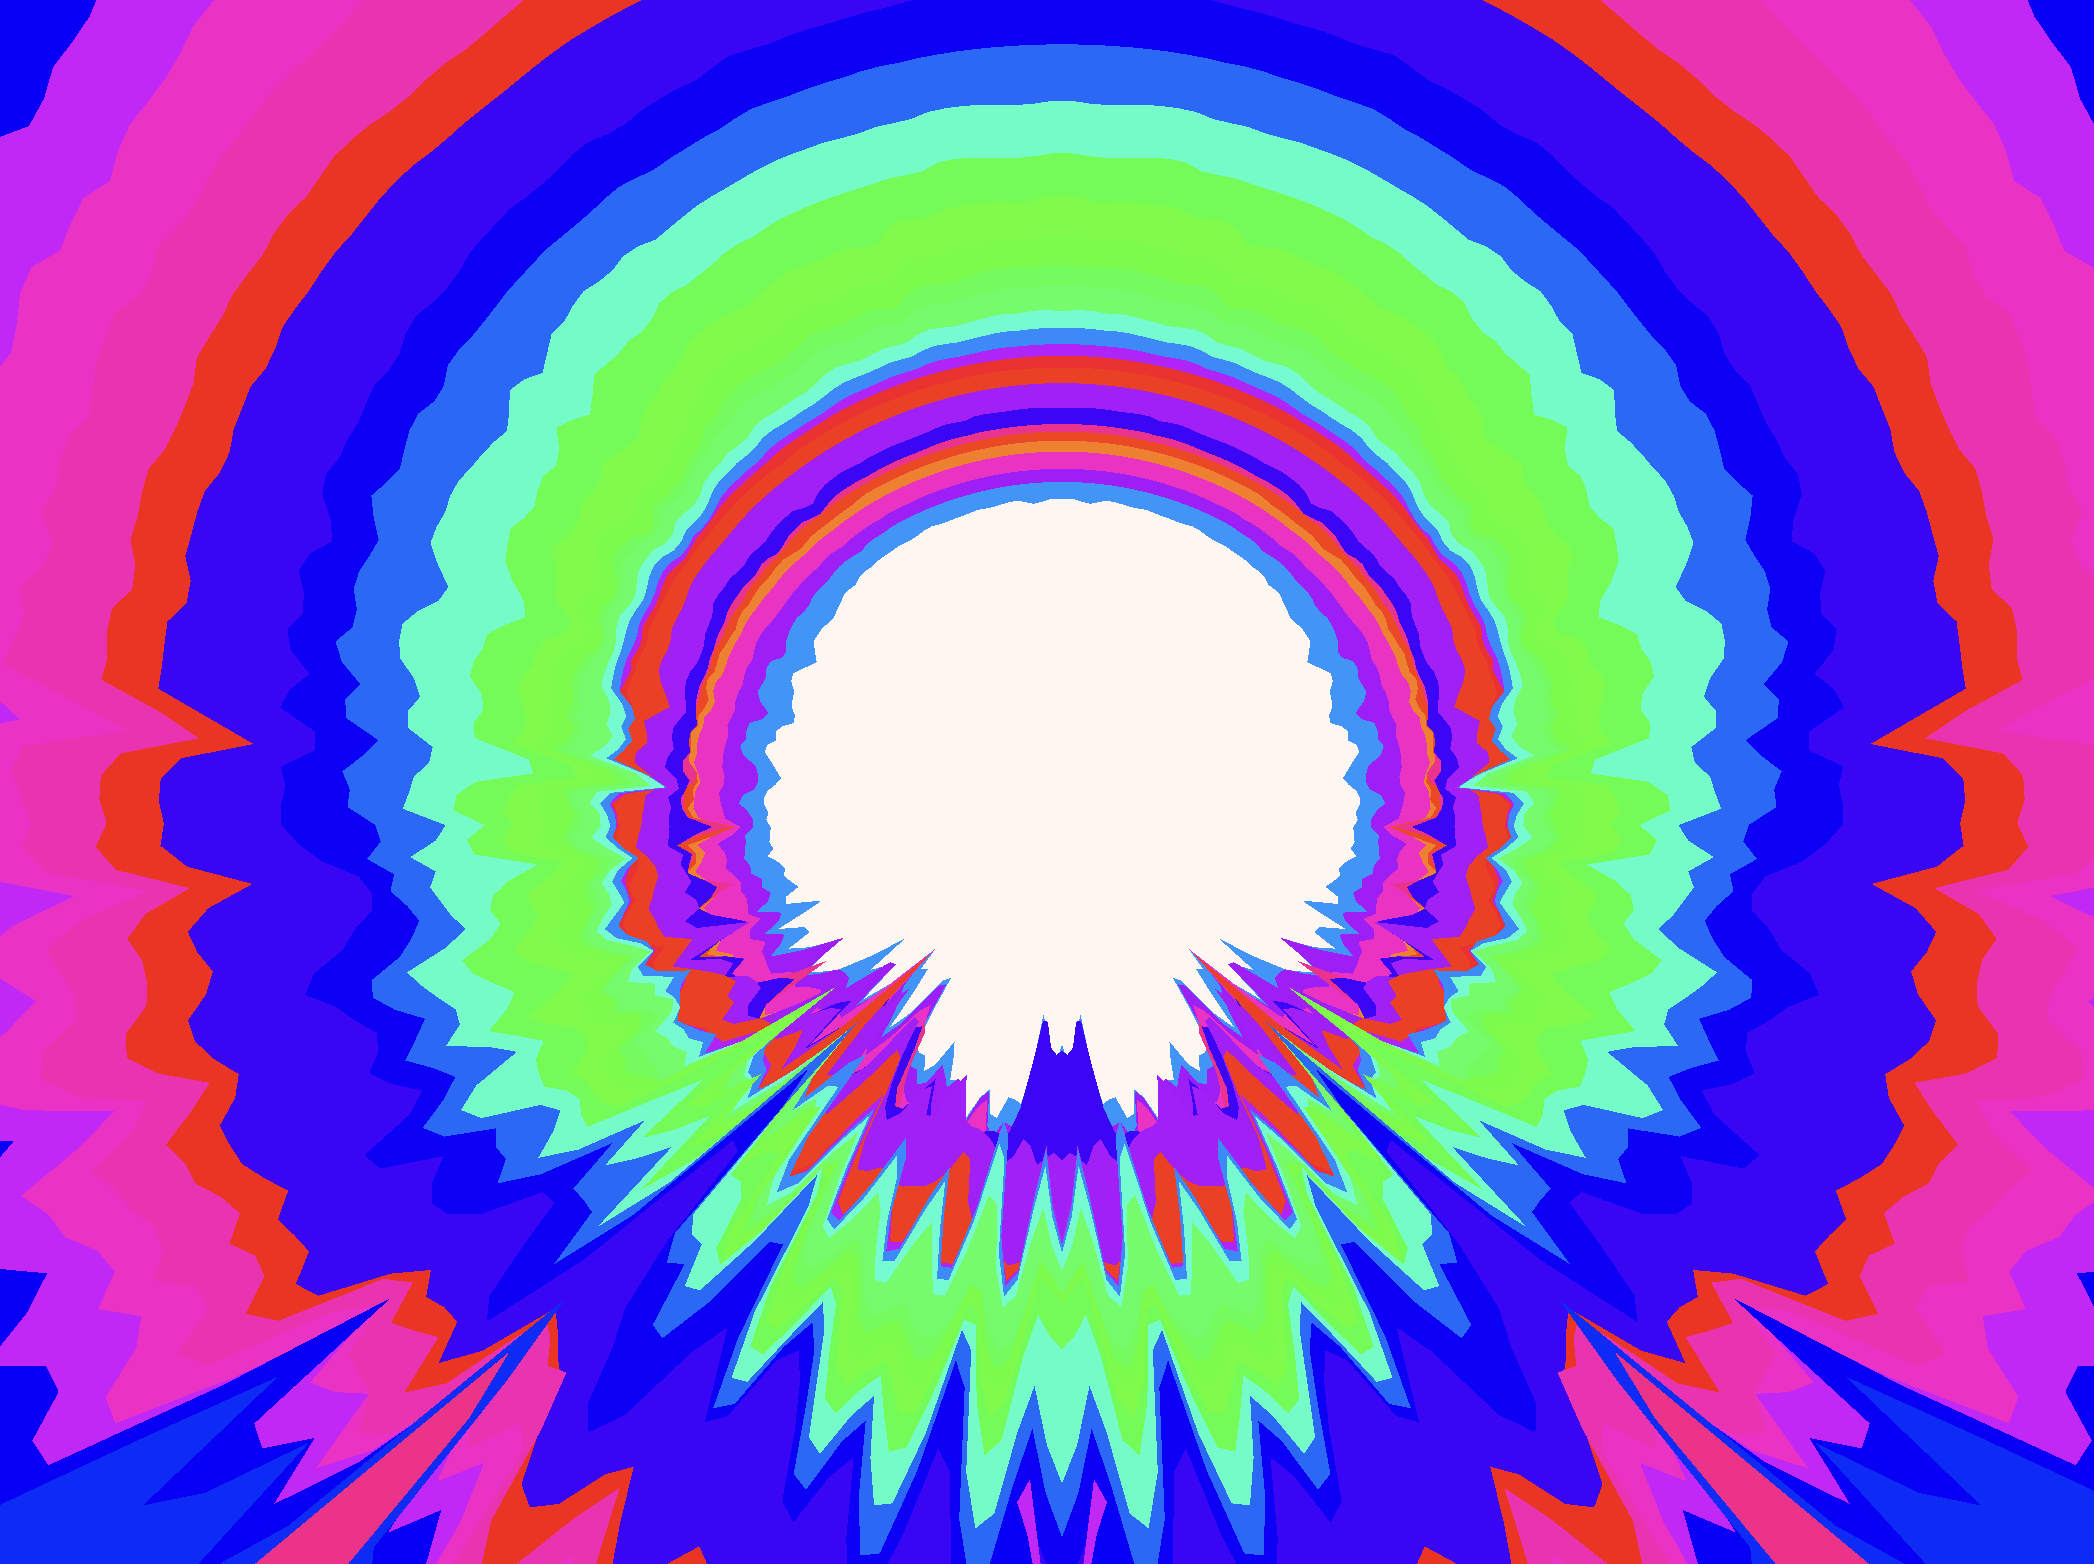
if you're like me, you're probably not a musical genius, nor an artistic one. but...you also want to play around with music and art and build something swanky n' cool... like these things!
when I started looking into building my own visualizer, I realized that I was super confused on figuring out how the webaudio API worked. the API is intended for special use audio applications, so piecing the API to visualizations can be a little confusing at first. this tutorial is intended for you to get a quickstart on the API and get a general idea of how it works. I won't be spoonfeeding you details on specifics on audio and visualizations, that is for you to figure out and experiment on!
the web audio API works in a graph formation. you have an input node (which can be your microphone, or a playing piece of audio), some nodes in the middle (analyser/filters/gain/other effects), and the destination node. this entire graph operates in the audio context.
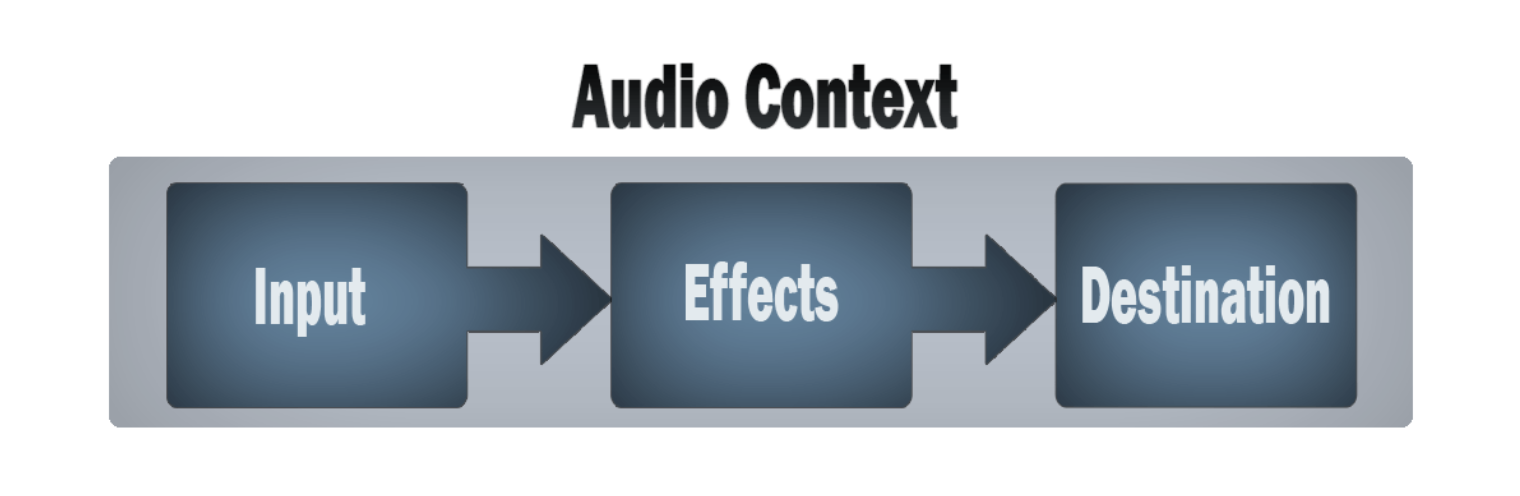
it's easy to set up an audio context like so...
window.AudioContext = window.AudioContext || window.webkitAudioContext;
const audioContext = new AudioContext();
and using the audio context, we'll be able to create our input buffer our analyser. the audio analyser will allow us to get data from the input channel or filter (depending on how you connect it)
const source = audioContext.createBufferSource();

const analyser = audioContext.createAnalyser();
analyser.fftSize = 2048;
const data = new Uint8Array(analyser.frequencyBinCount);
hmm...our source buffer is currently empty! we'll fetch an mp3 from somewhere, decode it into an audio buffer, and throw it into our source.
const decodeAudio = async (url: string) => {
    const response = await fetch(url);
    const arrayBuffer = await response.arrayBuffer();
    return await audioContext.decodeAudioData(arrayBuffer);
};

source.buffer = await decodeAudio('your_mp3_here.mp3');
let's connect it all together!
source.connect(analyser);

analyser.connect(audioContext.destination);
source ---> analyser ---> destination
one thing to note about the audio context is that it is real time. this means we'll get data about our song live, rather than get the entirety of our song processed. one way to think about this is that the input is like a microphone. a microphone won't be able to hear before or after a piece of audio, rather it'll only capture what it's hearing right now.
our analyser will give us the frequency of the song at the moment it's playing. this might feel
confusing (at least it was confusing for me) when trying to piece this to drawing art on a screen. but it's
suprisingly simple! for example, look at my html canvas draw function below:
function draw() {
	ctx.clearRect(0, 0, canvas.width, canvas.height)

	// our analyser will put frequency info into our data aray
	analyser.getByteFrequencyData(data)

	ctx.strokeStyle = `black`
	ctx.beginPath();
	ctx.moveTo(0, canvas.height);

	for (let i = 0; i < data.length; i++) {
		// data[i] is the amplitude height
		// we normalize it like below:
		const value = data[i] / 1024

		const y = canvas.height - canvas.height * value

		ctx.lineTo(i, y);
	}

	ctx.stroke();

	requestAnimationFrame(draw);
}

// we'll be able to start the source audio using this function!
// note that browsers will expect a click before starting an audio source. this is best paired with an onclick event.
source.start()
a constantly running draw function + an analyser that gets frequency data of our currently playing song will result in....
tada!!!!!!!
next steps
- Beat Detection using Web Audio
is a pretty great article on how you
can put beat detection in your project. his use case is vastly different from ours, so you'll need to figure out
how to modify his algorithm to fit your project
- MDN has plenty of articles that'll show you the intricacies of the web audio API.
- Basic concepts behind Web Audio API
goes into detail on digital audio as a whole. it also might be a better teacher than me :pf:
- Using Web Audio API
- Advanced techniques
if you're looking for more advanced stuff
- my own visualizer uses filters to help separate beats
- look for biquad filters! I used a lowpass and peaking filter to make beats more clear and
measurable
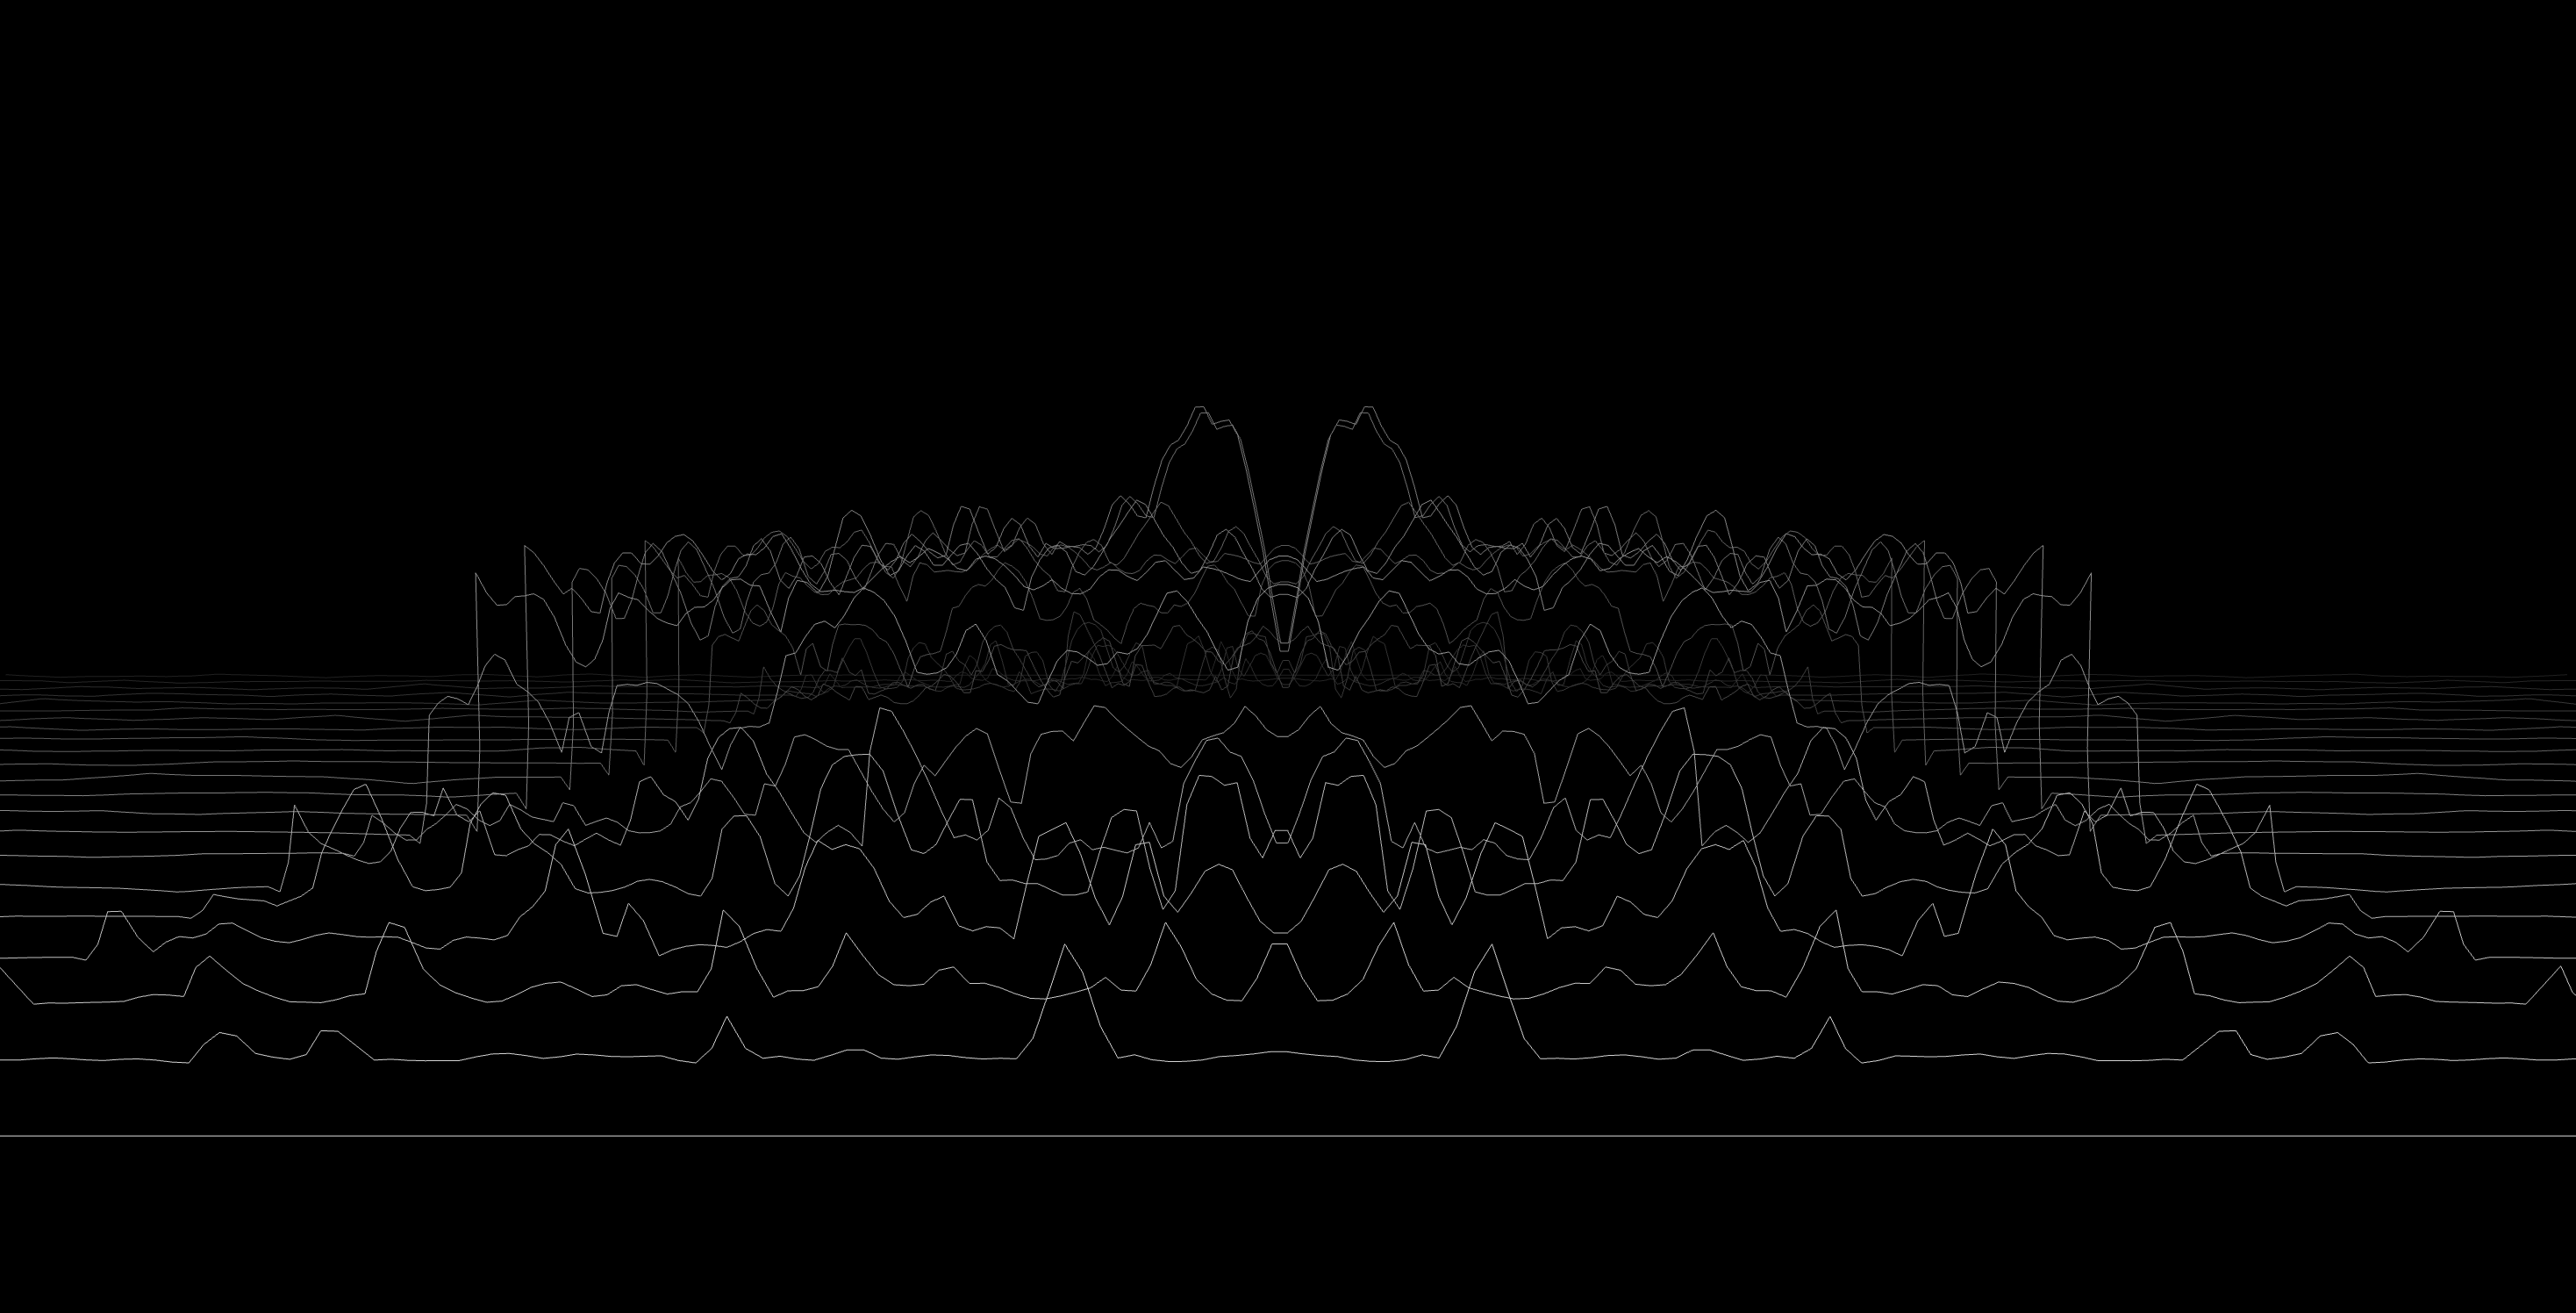
- look at time domains! this will give you the waveform on the...uh...time domain (it's a little hard to explain, but it'll look like this)
since it's the waveform over time, you could probably get the average energy of the wave. this might be useful
in detecting beats. RMS may also be helpful
- there are PLENTY of wonderful examples over at Awesome
Audio Viz
now... waveform!!
- Basic concepts behind Web Audio API goes into detail on digital audio as a whole. it also might be a better teacher than me :pf:
- Using Web Audio API
- Advanced techniques if you're looking for more advanced stuff
- look for biquad filters! I used a lowpass and peaking filter to make beats more clear and measurable
- look at time domains! this will give you the waveform on the...uh...time domain (it's a little hard to explain, but it'll look like this)
since it's the waveform over time, you could probably get the average energy of the wave. this might be useful in detecting beats. RMS may also be helpful
waveform was a hack club event in summer 2025 where participants built audio visualizers and received grants to buy music. the event has ended and submissions are closed, but feel free to use this tutorial to learn and build your own visualizer!
waveform is a project by hackclub <3